Graphs
Interview Essentials
A graph is an abstract data structure composed of nodes (sometimes called vertices) and edges between nodes. Graphs are a useful way of demonstrating the relationship between different objects.
Some real-life examples of graphs:
A social network can represent users as nodes, and two nodes are connected if the corresponding users are friends;
IMDb can represent actors as nodes, and two nodes are connected if the corresponding actors have been in the same movie;
IMDb can use actors and movies as nodes, and a "movie" node is connected to an "actor" node if the actor appeared in that movie. Movie nodes would not be connected to other movie nodes, and actor nodes are not connected to other actor nodes;
The power grid can be modeled as a graph between "source nodes" (power stations) and "consumer nodes" (power consumers) with junction nodes representing places where power lines split or merge. The power lines between nodes would be the edges in this example.
Digraphs
In some graphs, the edges are "one way", which means that it's important to distinguish between the "source" or "beginning" of an edge, and the "target" or "end" of the edge. These are called "directed edges", and a graph containing vertices and directed edges are called a digraph ("directed graph").
Some examples of digraphs:
A database can represent the table schema as nodes, and an edge from node
XtoYmeans "tableXhas a foreign key to tableY".Twitter can represent users as nodes, and an edge from node
XtoYmeans "userXfollows userY".Webpages can be modeled as nodes on a graph, and an edge from node
XtoYmeans "webpageXhas a link on it to pageY".
Graphs and Trees
If you've worked through either of the trees topics, you have already seen examples of graphs. Trees are special types of graphs - specifically, they are connected acyclic graphs with a single root node. Many problems that you have seen when using trees, such as using BFS or DFS, are also graph problems. The general graph versions tend to be a little trickier, because the graph can have cycles in it. Because there can be multiple paths between nodes, another common type of question is to find the "best" or "shortest" path between two nodes.
They are also useful ways of asking questions such as:
"Who are the actors that have more than 7 degrees of separation from Kevin Bacon?"
"How many single points of failure are there in the power grid?"
"Are there any completely isolated groups? If not, how many edges would we have to remove before the graph was disconnected?"
"What is the largest group of people on this site, where any pair of people from the group are friends?"
Crucial Terms
Node: Also referred to as a vertex. The set of objects that the graph gives the relationship between.
Edge: An unordered pair of nodes (v,w). The nodes vv and ww are referred to as the endpoints of the edge. Graphically represented as a connection between nodes vv and ww.
Weighted edge: A weighted edge is an edge in a graph that also has another piece of data associated with the edge, called the weight. This weight often represents a cost in terms of time or distance associated with using that edge.
Directed Edge: An ordered pair of vertices, (v,w). Graphically represented as an arrow from vv to ww. The node vv is referred to as the source or origin node, while the node ww is referred to as the destination or target node. A graph has only directed or undirected edges. An undirected edge between vv and ww can be simulated by having a pair of directed edges (v,w) and (w,v).
We will use the term graph to mean a graph with undirected edges, and digraph for a graph with directed edges.
There are a large number of definitions involving graphs, but most of them are reasonably obvious when looking at the graphical representation of a graph.
Path: Intuitively, a path between nodes vv and ww is a collection of edges you can use that "start at v" and "end at w" without taking any breaks along the way. The technical statement is that a path between v and w is a sequence of nodes v0=v,v1,v2,…,vn=w such that (vi,vi+1) is always an edge in the graph. This definition works for both graphs and digraphs.
Connected Graph: A graph is connected if there is a path between every pair of vertices. The intuitive notion is that it is possible to get from any given node to any other node. For digraphs, the notion of connectedness is more subtle. In the digram below, is the graph connected?
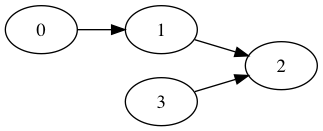
Here it is not possible to get from node 1 to node 3, nor from node 3 to node 1. A digraph that is connected if you replace all the edges with undirected edges, such as the example above, is called weakly connected. A strongly connected digraph is a diagram where there is a directed path between any pair of vertices.
Induced subgraph: An induced subgraph of G is a graph that uses a subset N of the nodes of G, and whose edges consist of all the edges that have both endpoints in N. (A simple subgraph is a subset of nodes and a subset of edges, such that each edge in the subgraph is an edge between nodes in the subgraph).
Connected component: Intuitively, the connected components of a graph are the disconnected pieces that the graph is in. The graph below has 3 connected components.

The technical definition is that a connected component C of G is a subgraph that is connected, and for which there is no connected subgraph C′ that contains C as a subgraph. To find the connected components of a graph, note that each node belongs to exactly one connected component. Starting at any node, perform either depth-first or breadth-first search.
Dense vs sparse: A graph with n vertices has at most n(n−1)/2 edges. The graph is dense if it has a "large fraction" of this maximum number of edges, and sparse if it has a "small fraction" of this maximum number of edges. There isn't a technical definition of where the crossover point between dense and sparse is. When choosing graph algorithms, you typically have a choice whether to iterate over nodes or edges, and your choice can have dramatically different computation times depending on whether the graph is dense or sparse.
There are many more definitions used to discuss graphs, but often different sources will use slightly different definitions for the same term. Even professional mathematicians will ask clarifying questions when dealing with problems in graph theory to ensure they are using the same definitions as the interviewer is. When preparing for graph theory, focus on learning algorithms to solve common problems, rather than trying to learn all the different terms.
Common Representations of Graphs
There are two common representations of graphs. To keep things simple, we'll assume that the n nodes are ordered by integers from 0 to n-1, so we can use position in an array to determine the relevant node. If the nodes have other labels, we can use HashMaps or an external array mapping integers to labels.
Adjacency-list representation We have a list-of-lists,
connections, whereconnections[i]is a list of the node labels that theithnode is connected to. An edge[i,j]is represented by havingj in connections[i]. In an undirected graph,j in connections[i]impliesi in connections[j], for a digraphconnections[i]contains all the nodes you can move to from theithnode.
If the graph is weighted, we can have connections[i] be the tuple (j, weight_ij).
Adjacency-matrix representation We have a n\times nn×n matrix
E. For an unweighted graph,E[i][j]is1if there is an edge[i,j]in the graph, and0otherwise. For a weighted graph,E[i][j]is the weight of edge[i,j], with a reserved value to indicate no edge. This reserved value is often0or-1, but this will change depending on the application. It is essential that the value used to indicate "no edge" cannot actually occur for a real edge in the problem.
So which one should you use? It depends on your use case. If m denotes the number of edges and n denotes the number of vertices, then we know for connected graphs (n -1)\leq m \leq n(n-1)/2(n−1)≤m≤n(n−1)/2. For example, on the graph below:
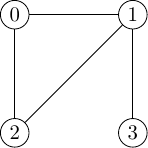
has the representations
adj_list = [[1,2], [0,2,3], [0,1], [1]]
The properties of the representations are summarized in the table below.
Representation
Lookup time
Memory usage
Adjacency List
O(m) (worst), O(m/n) average
O(m) (assuming connected)
Adjacency Matrix
O(1)
O(n2)
The adjacency list is never worse in memory than the adjacency matrix, and if the graph is sparse then it can be competitive in lookup time. If we drop the assumption that the graph is connected, then the memory usage of the adjacency list is O(n+m), as we need at least one array index per node in the graph.
For dense graphs, which structure is better for your problem depends on whether you are memory constrained, in which case you should choose an adjacency list, or if you will be time constrained with lookups, in which case you should choose an adjacency matrix. You can always choose to store edges in another data structure, such as storing the edges as keys to a hash table or in a set. However, most problems will give you the graph encoded using either an adjacency list or an adjacency matrix.
Classic Graph Algorithms to Expect in Interviews
Finding the Shortest Path
There are two variants for shortest path problems.
In an unweighted graph, we want to find a path between two vertices using the smallest number of edges possible. The go-to algorithm is breadth-first search. For example, if you wanted to find the number of degrees of separation between "Kevin Bacon" and "Gong Li", using a graph that had actors as nodes and connected edges if they were in the same movie would be a shortest path problem that would use BFS. (At the time of writing, "Kevin Bacon" and "Gong Li" had two degrees of separation).
If the graph is weighted, the length of the path is defined as the sum of the weights on the edges, not the number of edges. If none of the weights are negative, the standard approach is to use Dijkstra's algorithm. Here we couple BFS with a min-heap to look for the shortest path.
An pseudo-code implementation of Dijkstra's algorithm is
Notice that Dijkstra returns the distances between the source node and all the other nodes in the graph. If you are only interested in the distance between two particular nodes, the loop can be interrupted once you reach the target node. If the graph isn't connected, the loop can be optimized by returning as soon as dist[current] = infinity, as at this point the algorithm has visited all the nodes that are connected to source.
If you need to find the distances between any pair of nodes, or to find the shortest path between two nodes if there are negative weights on edges, you should use a different algorithm such as Bellman-Ford.
Minimum Spanning Tree
A "spanning tree" of a connected component with n nodes is a subgraph that has no cycles and leaves the n nodes connected. Every spanning tree has n-1 edges; for a typical graph there are multiple spanning trees.
In a weighted graph, the weight of the spanning tree is the cost of all edges used in the tree. The tree with the lowest weight is called the "minimum spanning tree". A typical example of where a minimum spanning tree is useful is where the edges represent potential connections we could make between objects, and the weights are the cost of building those connections. A minimum spanning tree then gives a way of connecting all the objects for the smallest costs. While the cost of a minimum spanning tree is unique, the tree itself is generally not unique.
There are two well known algorithms for finding a minimum spanning tree: building node-by-node (Prim's algorithm), or edge-by-edge (Kruskal's algorithm).
Prim's algorithm
Initialize: Choose a vertex from the connected component at random. This vertex (and no edges) is your current solution.
While there are still nodes not in your current solution:
Find the vertex v′ that is closest to a vertex in your current solution. Break ties arbitrarily.
Add v′and the shortest edge from a node in your current solution to v′ to your current solution.
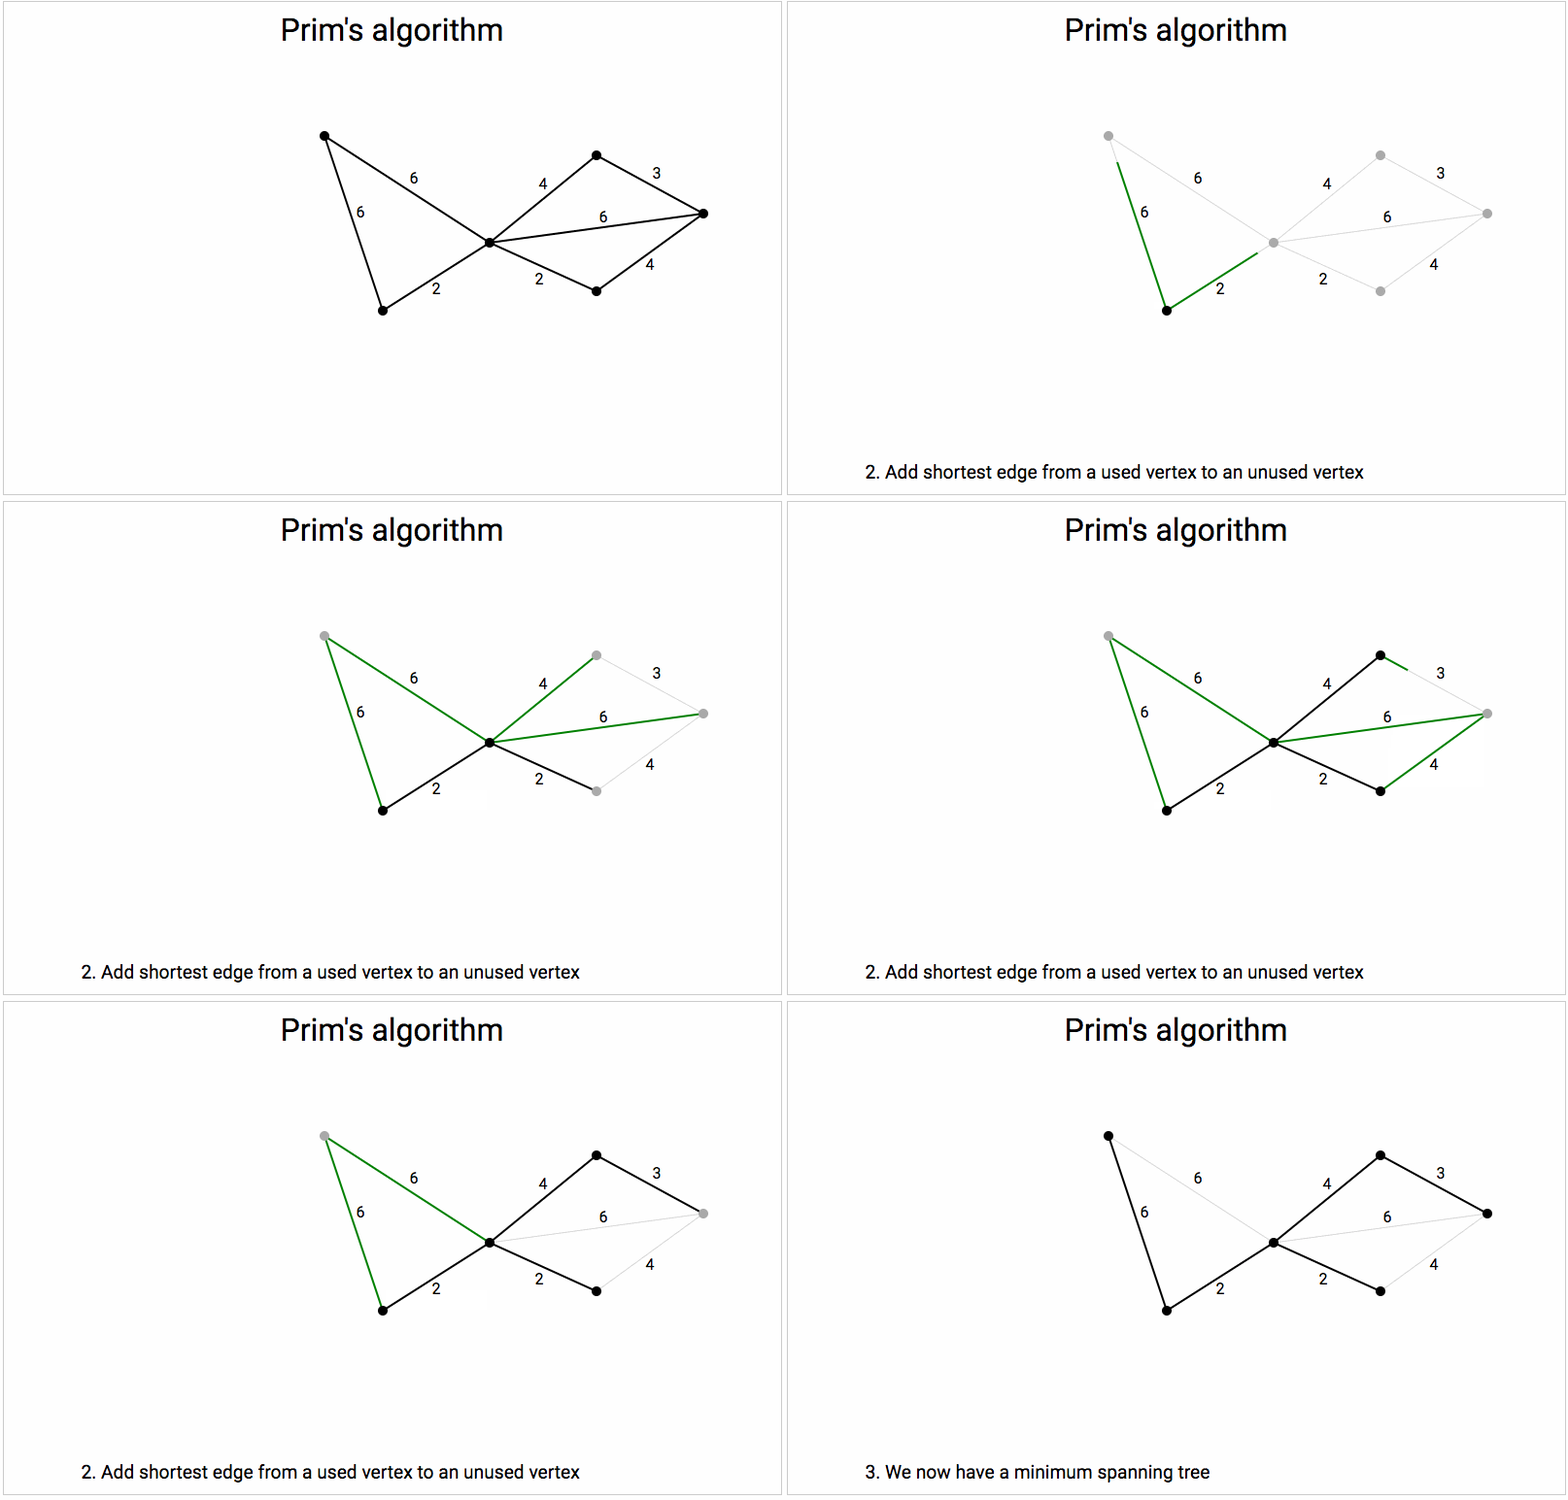
Most of the work in Prim's algorithm is finding the closest vertex to any node in the current solution. That is, we are looking for the lowest weight edge with one endpoint in the current solution, and the other endpoint not in the solution. An efficient approach is to maintain a min-heap of edges with exactly one endpoint in the solution. This slick use of a heap comes at the cost of having to do extra bookkeeping. Whenever a node v′ is absorbed into the solution, all edges between v′and other nodes in the solution have to be removed from the heap, and all edges between v′and edges not in the solution have to be added.
Kruskal's algorithm
Initialize: Start with a sorted list of edges E in the original graph. Start with an empty set of desired edges S.
While ∣E∣ is not equal to
n-1:Remove the shortest edge e from the set E;
If adding e wouldn't create a cycle, add the edge e to S.
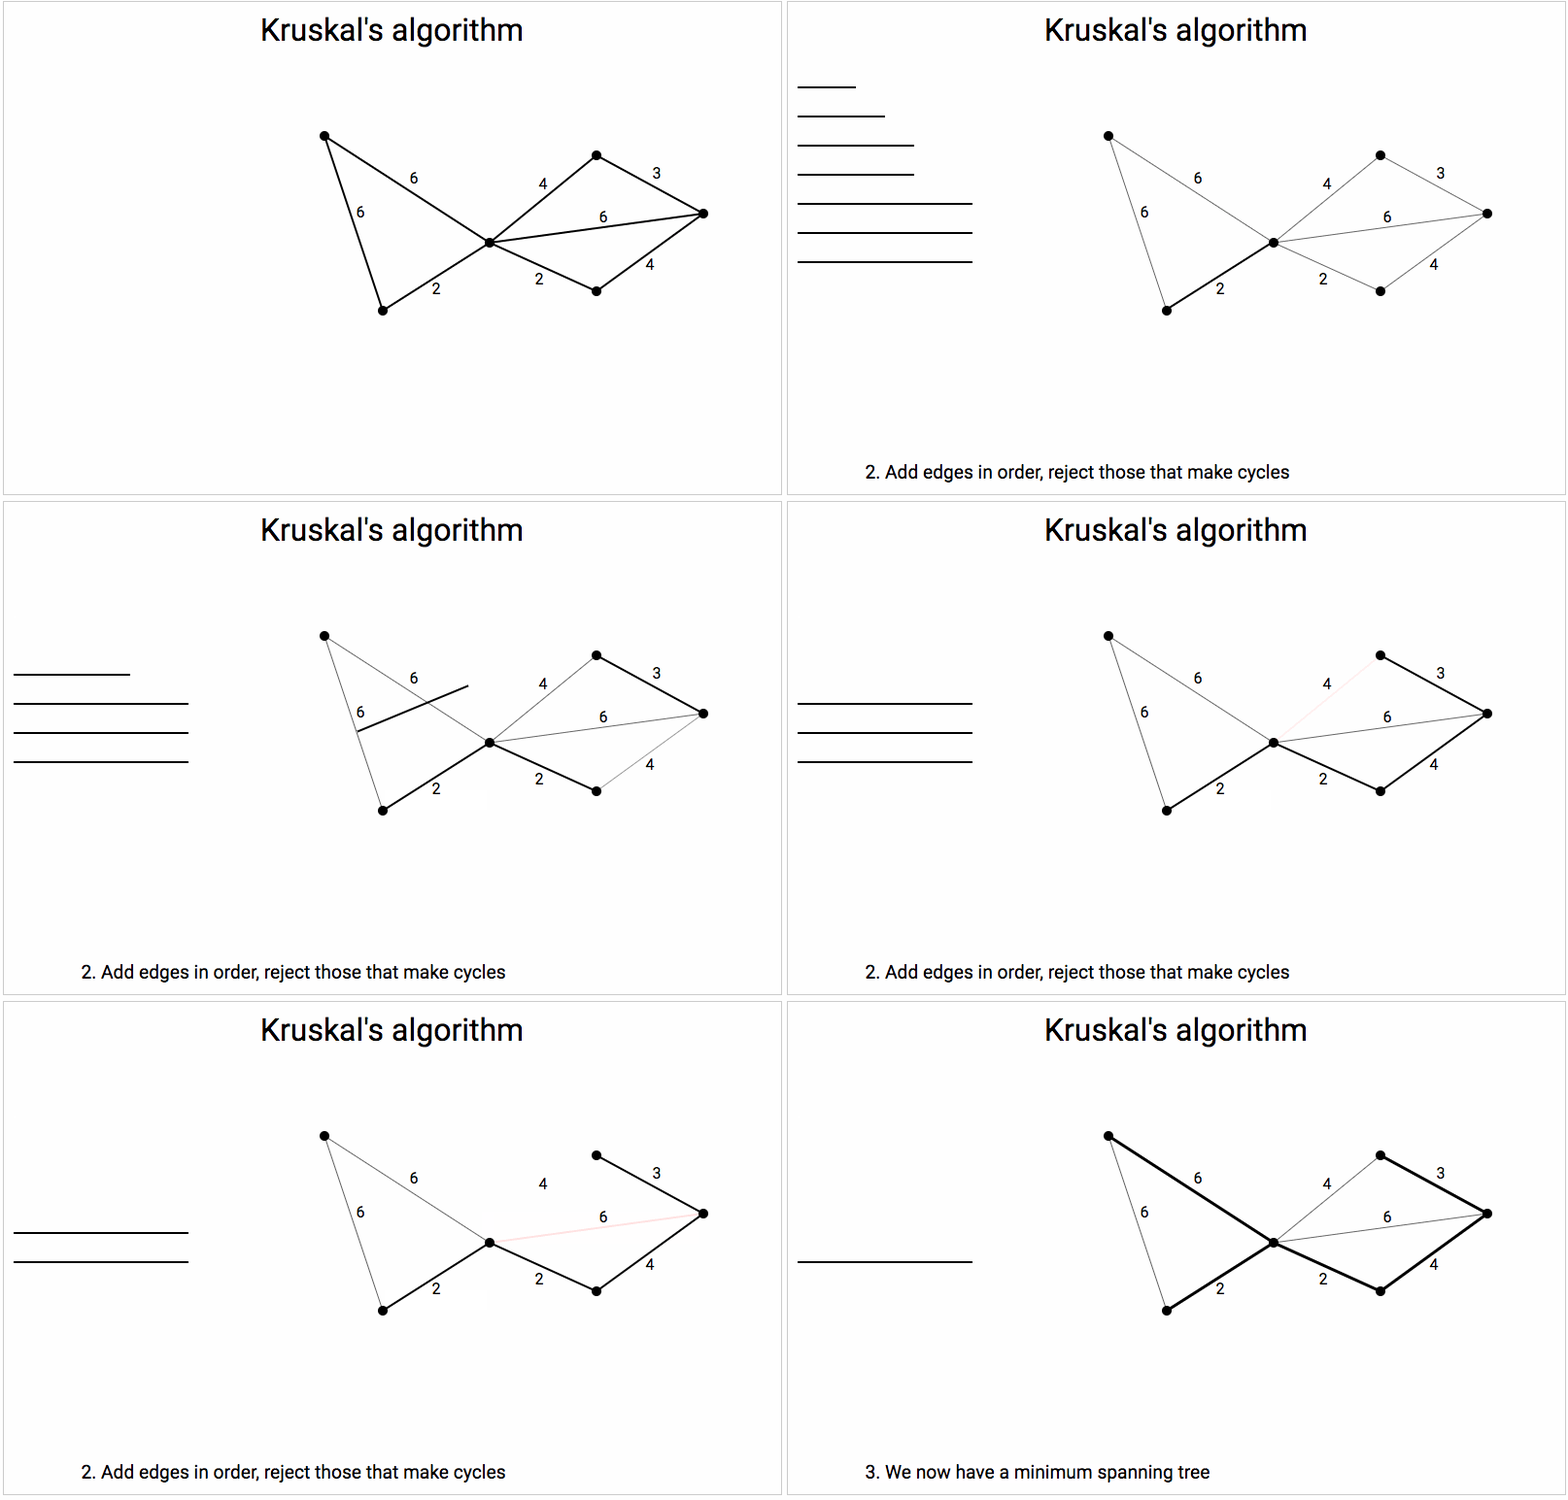
Most of the work in Kruskal's algorithm comes from sorting the original edges, which is an O(m log m) operation. Since m≤n2,logm≤2logn, this is also an O(m log n) operation.
The other place we might be concerned about the amount of work is when we try to determine if adding an edge e would create a cycle. Using a union-find data structure (also called a disjoint set), we can make this a very fast operation. The idea is that we are going to label vertices according to which connected component of the current solution they belong to. (They all belong to the same connected component of the complete graph!) In more detail:
Start with an array of
nintegers in an arraycompt, all initialized to zero. InitializenextComponent = 1.When adding an edge with endpoints
iandj, checkcompt[i]andcompt[j]. There are four possibilities:If
compt[i] == compt[j], and they are not zero, theniandjbelong to the same connected component of the solution. Adding this edge would make a cycle, so skip this edge.If exactly one of
compt[i]andcompt[j]is zero, you are growing the non-zero component. Set bothcompt[i]andcompt[j]to the non-zero value, and use the edge.If both
compt[i]andcompt[j]are both zero, then we are creating a new component that is disconnected from the edges we collected in SS. Setcompt[i]andcompt[j]tonextComponent, and increasenextComponentby 1. Use the edge.If
compt[i] ≠ compt[j], then we are merging two different components. Scancompt, changing all instances ofcompt[i]tocompt[j]. Use the edge.
Coloring a Graph
A coloring of a graph is a way of assigning a color to each node such that no two nodes that are connected by an edge have the same color.
A graph is kk-colorable if it can be colored with at most kk distinct colors. The chromatic number of a graph is the smallest number of colors needed to make a coloring of the graph.
Coloring problems are surprisingly difficult. To determine the chromatic number of an arbitrary graph is an NP-complete problem (in other words, it's really hard). Perhaps more surprising, answering the "yes/no" question of whether a graph is 3-colorable is also NP-complete! The simplest approach for coloring, at least in the types of graphs that are likely to come up as an interview task, is to use a backtracking algorithm for assigning the nodes different colors. If you're trying to determine the chromatic number of a graph, try determining if it's two colored using a trick, then try using backtracking with 3 colors, then 4, then 5, etc. until you have found a coloring that works.
The trick for determining if a graph is 2-colorable is by looking at its simple cycles (the paths that only repeat the first and last vertex). If all simple cycles have an even number of vertices, the graph is 2-colorable, otherwise it isn't. Technically a "graph" can be 1-colorable, but only if it has no edges.
The coloring of a graph is really just a labeling of its vertices. The term "coloring" originated from mapmakers trying to color maps. Different areas were represented as nodes, and an edge between two nodes meant they shared a border and shouldn't be the same color. As an example, the animation below shows the process of turning the map of the 48 contiguous United States into a graph, and how a coloring of the graph can be used to provide a coloring of the map.
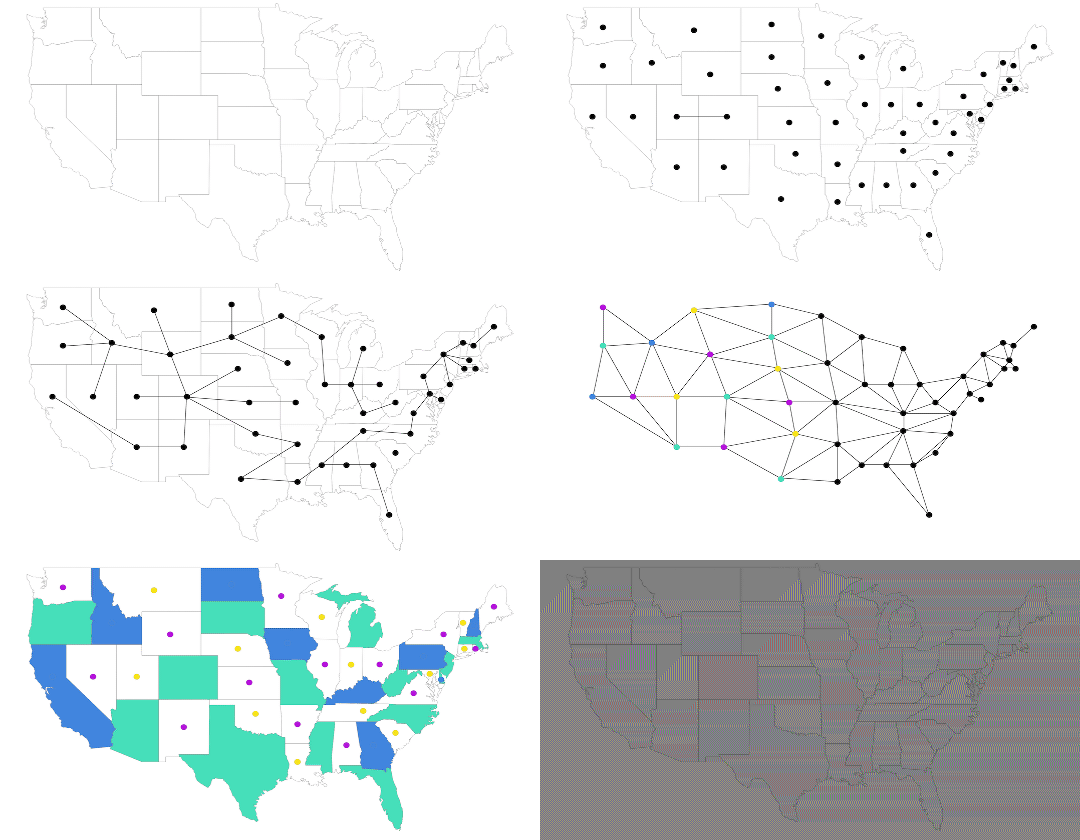
The 4-color theorem states that any planar graph, that is, a graph that can be written on a piece of paper without any edges crossing, is 4-colorable. Any map we choose will produce a planar map, provided we ignore "borders" that consist of a single point (such as the 4-corners in the United States).
A lot of constraint problems can be expressed as graph coloring problems:
Determining the number of meeting times needed for busy people can be cast as a coloring problem. Specifically, if a group of people have to break into groups for meetings, two meetings that don't have any attendees in common can be held at the same time. If there are common attendees, the meetings shouldn't overlap. To cast this as graph problem, let the nodes be the different meetings that have to occur, and two nodes are connected by an edge if some people have to attend both meetings. If provided with a coloring of this graph, every meeting assigned to the same color can be held simultaneously (because no two nodes assigned the same color can share an edge). The number of different colors is the number of non-overlapping meeting times needed.
You need to seat a large family at a wedding. Sadly, there are some people that shouldn't sit together. To turn this into a coloring problem, make the nodes people, and draw an edge between them if they shouldn't be at the same table. Given a coloring of this graph, you can safely assign all people that have been tagged with the same color to the same table. The number of colors used is the number of tables you will need.
The tricky part about setting up problems as coloring problems is that we need to connect "things" in the problem that are not allowed to be together in the solution.
Matching
A matching on an undirected graph is a way of selecting edges so that every vertex is incident to at most one edge. One of the most common matching problems is also the simplest: looking for matches when the nodes have two different types, and only nodes of different types can be joined. These are called bipartite graphs, and can be technically defined as graphs that are 2-colorable.
A famous example is making matchings between medical students who are looking for residencies, and the positions available at hospitals. Each resident can be assigned to only one available position, and each position can be filled by at most one resident. If we create nodes that are the positions and the residents, and an edge between a "resident" node and a "position" node means "this resident is assigned to that position", a valid placement of residents into positions is a matching on this graph. This is similar to the problem of job applicants applying to positions.
Generally, not all matches are created equal. On a weighted graph, you might be trying to select the edges in the graph that make a matching with the highest weight. In the resident/hospital application problem, residents have preferences about which hospitals they want to work at, and hospitals will have preferences about the residents they want to work there. In this case, you might have some measure of how to get everyone as close to their first choice as possible. A stable match is one where neither party is tempted to "defect" for a better offer once they've accepted the position.
In Interviews, Use Graphs When ...
In some cases, the question will be explicitly about graphs, such as asking how many connected components are in a graph given its adjacency matrix. If given a map of cities, and the roads between them along with their distances, and you are asked to find the shortest path between city A and city B, you would probably be thinking about Dijkstra's algorithm.
In other problems, the connection is more subtle. It isn't immediately obvious that the question of how many dinner tables you need to seat people, if certain people cannot be seated at the same table, is a graph coloring problem in disguise. Strictly speaking, it's an NP-complete graph theory problem in disguise! A direct method of approaching this problem, with backtracking, might be equivalent to the way you solve the graph theory coloring problem. So what does knowledge of graph theory get you in this instance? Since you know already that the problem is hard, you can relax a little when you start writing your backtracking algorithm when you realize that it isn't going to be polynomial time (because you know solving this problem is as hard as solving an NP-complete problem). Or maybe you know that if you want a reasonable running time, you are going to need to memoize some intermediate results.
The big value in graph theory comes in finding the relationship between problems, as well as knowing the best approaches for those classes of problem.
Last updated